
Rockwell Medical Announces Second Quarter 2026 Results
Net Sales for the second quarter 2026 were $17.8 million, an increase over net sales for the first quarter 2026 and an
Press Release Disclaimer: This is a press release distributed through the XPR Media network. It has not been independently verified by our newsroom.


Rockwell Medical, Inc. (the “Company”) (Nasdaq: RMTI), a healthcare company that develops, manufactures, commercializes, and distributes a portfolio of hemodialysis products to dialysis providers worldwide, today announced financial and operational results for the three and six months ended June 30, 2026.
This press release features multimedia. View the full release here: https://www.businesswire.com/news/home/20260813588314/en/
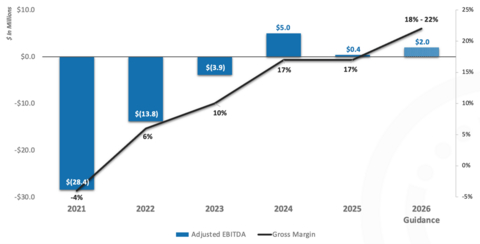
Rockwell Medical’s Profitability Trend (2021-2026)
“The momentum in our business continues to build. Our second quarter results reflect the outcome of the actions we have taken to strengthen our commercial position, improve operational efficiency, and enhance profitability,” said Mark Strobeck, Ph.D., Rockwell Medical’s President and CEO. “We are a fundamentally stronger company today, with a growing customer base, improving margins, a solid cash position, and a clear path toward achieving our 2026 guidance. As we enter the second half of the year, we remain focused on executing our growth strategy, expanding profitability, generating positive cash flow, and delivering long-term value for shareholders.”
FINANCIAL HIGHLIGHTS
Net Sales
- Net sales for the three months ended June 30, 2026 were $17.8 million, which represents an 11% increase over net sales of $16.1 million for the same period in 2025 primarily driven by additional sales to new customers in the Western United States and greater purchasing from our existing customers.
- Net sales for the six months ended June 30, 2026 were $35.1 million, representing a slight increase over the same period in 2025.
Gross Profit
- Gross profit for the three months ended June 30, 2026 was $3.2 million, which represents an increase of 30% over $2.5 million for the same period in 2025 primarily driven by lower manufacturing costs and higher volume.
- Gross profit for the six months ended June 30, 2026 was $6.1 million, which represents an 11% increase over the same period in 2025.
Gross Margin
- Gross margin for the three months ended June 30, 2026 was 18%, up from 16% for the same period in 2025.
- Gross margin for the six months ended June 30, 2026 was 17%, up from 16% for the same period in 2025.
Net Income (Loss)
- Net loss for the three months ended June 30, 2026 was $1.2 million, which represents an improvement over a net loss of $1.5 million for the same period in 2025, and an improvement over a net loss of $1.6 million in the first quarter of 2026.
- Net loss for the six months ended June 30, 2026 was $2.8 million, which represents an improvement over a net loss of $3.0 million for the same period in 2025.
Adjusted EBITDA
- Adjusted EBITDA for the three months ended June 30, 2026 was ($0.2) million, which was in-line with Adjusted EBITDA of ($0.2) million for the same period in 2025.
- Adjusted EBITDA for the six months ended June 30, 2026 was ($0.4) million, which represents an improvement compared to Adjusted EBITDA of ($0.7) million for the same period in 2025.
Cash, Cash Equivalents and Investments Available-for-Sale
- Cash and cash equivalents and investments available-for-sale at June 30, 2026 was $24.8 million, which represents an increase over $23.9 million at the end of the first quarter 2026 and in line with the Company’s cash position at year-end 2025.
|
|
Three Months Ended June 30, |
|
Six Months Ended June 30, |
||||||||||||
|
(In Millions, Except Per Share Amounts) |
|
2026 |
|
|
|
2025 |
|
|
|
2026 |
|
|
|
2025 |
|
|
Net Sales |
$ |
17.8 |
|
|
$ |
16.1 |
|
|
$ |
35.1 |
|
|
$ |
35.0 |
|
|
Gross Profit |
|
3.2 |
|
|
|
2.5 |
|
|
|
6.1 |
|
|
|
5.5 |
|
|
Operating Income (Loss) |
|
(1.1 |
) |
|
|
(1.3 |
) |
|
|
(2.5 |
) |
|
|
(2.7 |
) |
|
Net Income (Loss) |
|
(1.2 |
) |
|
|
(1.5 |
) |
|
|
(2.8 |
) |
|
|
(3.0 |
) |
|
|
|
|
|
|
|
|
|
||||||||
|
Adjusted EBITDA** |
|
(0.2 |
) |
|
|
(0.2 |
) |
|
|
(0.4 |
) |
|
|
(0.7 |
) |
|
|
|
|
|
|
|
|
|
||||||||
|
Basic and Diluted Net Income |
$ |
(0.34 |
) |
|
$ |
(0.48 |
) |
|
$ |
(0.74 |
) |
|
$ |
(0.92 |
) |
|
Adjusted EPS ** |
$ |
(0.04 |
) |
|
$ |
(0.07 |
) |
|
$ |
(0.11 |
) |
|
$ |
(0.20 |
) |
|
* See Note 3 for more details related to Basic and Diluted Weighted Average Shares Outstanding on Form 10-Q filed August 13, 2026. |
|
** See reconciliation to GAAP financial measures in the tables below. |
OPERATING HIGHLIGHTS
- In May 2026, the Company announced that it entered into a three-year product purchase agreement with Heritage Dialysis, with options to renew for three additional one-year periods.
- In May 2026, the Company announced that it renewed and extended its product purchase agreement with aQua Dialysis for two years with options to renew for two additional one-year periods.
- In June 2026, the Company announced a 1-for-10 reverse stock split of its issued and outstanding common stock to regain compliance with the Nasdaq Capital Market’s $1.00 minimum bid price requirement. The reverse stock split became effective at 12:01am EDT on July 1, 2026. The Company’s common stock continues to trade under the symbol “RMTI” on the Nasdaq Capital Market. The new CUSIP number following the reverse stock split is 774374409. All share and per-share amounts in this press release have been retrospectively adjusted to reflect the split for all periods presented.
-
Subsequent to the end of the second quarter 2026, the Company announced that it received notice from Nasdaq that the Company regained compliance with the minimum bid requirement under Nasdaq Listing Rule 5550(a)(2). Nasdaq has closed the matter.
2026 GUIDANCE
In 2026, Rockwell Medical continues to focus on growing revenue, improving operational efficiencies, and achieving sustained profitability. The Company is implementing pricing adjustments to better align product value with market dynamics, and is further streamlining and enhancing its operational efficiencies and distribution footprint to generate additional savings. Rockwell Medical reiterates its 2026 annual guidance as follows:
|
|
2026 Annual Guidance |
|
Net Sales |
$70.0M to $75.0M |
|
Gross Margin |
18% to 22% |
|
Adjusted EBITDA |
$1.0M to $2.0M |
|
Operating Cash Flow |
Positive |
WEBCAST DETAILS
Date: Thursday, August 13, 2026
Time: 8:00 a.m. ET
Webcast and Replay: www.RockwellMed.com/Results
Speakers:
- Mark Strobeck, Ph.D. — President and Chief Executive Officer
- Jesse Neri — SVP, Chief Financial Officer
Format: Discussion of second quarter 2026 financial and operational results followed by Q&A.
NON-GAAP FINANCIAL MEASURES
To supplement Rockwell Medical’s unaudited condensed consolidated statements of operations and unaudited condensed consolidated balance sheets, which are prepared in conformity with generally accepted accounting principles in the United States of America (“GAAP”), this press release also includes references to Adjusted EBITDA, a non-GAAP financial measure that is defined as net income (loss) before net interest income (expense), net other income (expense), income tax expenses (benefit), depreciation and amortization, impairment charges, stock-based compensation expense, and other items that are considered unusual or not representative of underlying trends of our business, including but not limited to one-time severance costs, deferred revenue and inventory reserve amounts, if applicable for the periods presented. The Company has provided a reconciliation of net loss, the most directly comparable GAAP financial measure, to Adjusted EBITDA. In addition, this press release includes a reference to Adjusted EPS, a non-GAAP financial measure that is defined as Adjusted EBITDA divided by the weighted average number of shares outstanding. The Company has also provided a reconciliation to EPS, or net income divided by the weighted average number of shares outstanding, which is the most directly comparable GAAP financial measure. Each of these adjusted measures is a non-GAAP financial measure. The Company has provided reconciliations to the GAAP measures at the end of this press release.
Adjusted EBITDA and Adjusted EPS are key measures used by Rockwell Medical to understand and evaluate operating performance and trends, to prepare and approve its annual budget and to develop short- and long-term operating plans. The Company provides Adjusted EBITDA because it believes the metric is helpful in highlighting trends in its operating results because it excludes items that are not indicative of Rockwell Medical’s core operating performance. In particular, the Company believes that the exclusion of the items eliminated in calculating Adjusted EBITDA provides useful measures for period-to-period comparisons of Rockwell Medical’s business. This is also true for Adjusted EPS, which is derived from Adjusted EBITDA.
Adjusted EBITDA and Adjusted EPS should not be considered in isolation of, or as an alternative to, measures prepared in accordance with GAAP. Other companies, including companies in the same industry, may calculate similarly titled non-GAAP financial measures differently or may use other measures to evaluate their performance, all of which could reduce the usefulness of Adjusted EBITDA and Adjusted EPS as tools for comparison. There are a number of limitations related to the use of these non-GAAP financial measures rather than the most directly comparable financial measure calculated in accordance with GAAP. When evaluating the Company’s performance, you should consider Adjusted EBITDA and Adjusted EPS alongside other financial performance measures, including net loss, EPS and other GAAP results.
ABOUT ROCKWELL MEDICAL
Rockwell Medical, Inc. (Nasdaq: RMTI) is a healthcare company that develops, manufactures, commercializes, and distributes a portfolio of hemodialysis products for dialysis providers worldwide. Rockwell Medical’s mission is to provide dialysis clinics and the patients they serve with the highest quality products supported by the best customer service in the industry. Rockwell is focused on innovative, long-term growth strategies that enhance its products, its processes, and its people, enabling the Company to deliver exceptional value to the healthcare system and provide a positive impact on the lives of hemodialysis patients. Hemodialysis is the most common form of end-stage kidney disease treatment and is typically performed in freestanding outpatient dialysis centers, hospital-based outpatient centers, skilled nursing facilities, or a patient’s home. Rockwell Medical’s products are vital to vulnerable patients with end-stage kidney disease, and the Company is relentless in providing unmatched reliability and customer service. Certified as a Great Place to Work® four years in a row (2023-2026) and named Fortune Best Workplaces in Manufacturing & Production™ in 2024 and 2025, Rockwell Medical is Driven to Deliver Life-Sustaining Dialysis Solutions™. For more information, visit www.rockwellmed.com.
FORWARD-LOOKING STATEMENTS
Certain statements in this press release may constitute “forward-looking statements” within the meaning of the federal securities laws. Words such as, “may,” “might,” “will,” “should,” “believe,” “expect,” “anticipate,” “estimate,” “continue,” “could,” “can,” “would,” “develop,” “plan,” “potential,” “predict,” “forecast,” “project,” “intend,” “look forward to,” “remain confident,” “remain steadfast,” “guidance,” “working to,” “goal” or the negative of these terms, and similar expressions, or statements regarding intent, belief, or current expectations, are forward looking statements. Such statements include without limitation statements relating to: our financial guidance, including projections regarding net sales, gross margin, Adjusted EBITDA and operating cash flow; and our expectations regarding the outcome of our focus on executing our growth strategy, expanding profitability, generating positive cash flow, and delivering long-term value for shareholders. While Rockwell Medical believes these forward-looking statements are reasonable, undue reliance should not be placed on any such forward-looking statements, which are based on information available to us on the date of this release. These forward-looking statements are based upon current estimates and assumptions and are subject to various risks and uncertainties (including, without limitation, those set forth in Rockwell Medical’s SEC filings), many of which are beyond our control and subject to change. Actual results could be materially different. Risks and uncertainties include but are not limited to those risks more fully discussed in the “Risk Factors” section of our Annual Report on Form 10-K for the year ended December 31, 2025, as such description may be amended or updated in any subsequent reports filed with the SEC. Rockwell Medical expressly disclaims any obligation to update our forward-looking statements, except as may be required by law.
Financial Tables Follow
| (Dollars In Thousands) | |||||
| June 30, | June 30, | ||||
|
2026 |
2025 |
||||
| Cash, Cash Equivalents & Investments available-for-sale |
$ |
24,797 |
$ |
18,422 |
|
| Total Assets |
$ |
56,526 |
$ |
52,625 |
|
| Total Liabilities |
$ |
21,441 |
$ |
22,216 |
|
| Total Stockholders’ Equity |
$ |
35,085 |
$ |
30,409 |
|
| Common Stock Outstanding |
|
3,972,029 |
|
3,443,034 |
|
| Common stock and common stock equivalents* |
|
4,979,904 |
|
4,504,626 |
|
| *Common stock and common stock equivalents: | |||||
| Common stock |
|
3,972,029 |
|
3,443,034 |
|
| Options to purchase common stock |
|
318,493 |
|
334,189 |
|
| Restricted stock awards |
|
– |
|
89 |
|
| Restricted stock units |
|
77,334 |
|
116,666 |
|
| Preferred stock converted |
|
141,900 |
|
140,500 |
|
| Restricted stock units – Market Condition |
|
71,700 |
|
71,700 |
|
| Common stock warrants |
|
398,448 |
|
398,448 |
|
| Total common stock and common stock equivalents |
|
4,979,904 |
|
4,504,626 |
|
| ROCKWELL MEDICAL, INC. AND SUBSIDIARIES | |||||||||||||
| UNAUDITED CONDENSED CONSOLIDATED STATEMENT OF OPERATIONS | |||||||||||||
| (In Thousands, Except Shares and Per Share Amounts) | |||||||||||||
| Three Months Ended June 30, 2026 | Three Months Ended June 30, 2025 | Six Months Ended June 30, 2026 | Six Months Ended June 30, 2025 | ||||||||||
| Net Sales |
$ |
17,780 |
|
$ |
16,071 |
|
$ |
35,116 |
|
$ |
34,985 |
|
|
| Cost of Sales |
|
14,537 |
|
|
13,568 |
|
|
28,976 |
|
|
29,440 |
|
|
| Gross Profit |
|
3,243 |
|
|
2,503 |
|
|
6,140 |
|
|
5,545 |
|
|
| Research and Product Development |
|
40 |
|
|
– |
|
|
40 |
|
|
– |
|
|
| Selling and Marketing |
|
577 |
|
|
572 |
|
|
1,144 |
|
|
1,283 |
|
|
| General and Administrative |
|
3,687 |
|
|
3,280 |
|
|
7,497 |
|
|
6,971 |
|
|
| Operating Income (Loss) |
|
(1,061 |
) |
|
(1,349 |
) |
|
(2,541 |
) |
|
(2,709 |
) |
|
| Other (Expense) Income | |||||||||||||
| Realized Gain on Investments |
|
130 |
|
|
64 |
|
|
250 |
|
|
120 |
|
|
| Interest Expense |
|
(281 |
) |
|
(276 |
) |
|
(563 |
) |
|
(553 |
) |
|
| Interest Income |
|
40 |
|
|
69 |
|
|
77 |
|
|
135 |
|
|
| Total Other Expense |
|
(111 |
) |
|
(143 |
) |
|
(236 |
) |
|
(298 |
) |
|
| Net Income (Loss) |
$ |
(1,172 |
) |
$ |
(1,492 |
) |
$ |
(2,777 |
) |
$ |
(3,007 |
) |
|
| Basic and Diluted Net Loss per Share |
$ |
(0.34 |
) |
$ |
(0.48 |
) |
$ |
(0.74 |
) |
$ |
(0.92 |
) |
|
| Basic and Diluted Weighted Average Shares Outstanding |
|
3,958,568 |
|
|
3,431,130 |
|
|
3,950,245 |
|
|
3,420,448 |
|
|
| Reconciliation to GAAP Financial Measures | |||||||||||||||
| (In Thousands, Except Shares and Per Share Amounts) | |||||||||||||||
| Three Months Ended | Six Months Ended | ||||||||||||||
| June 30 | June 30 | ||||||||||||||
|
|
2026 |
|
|
2025 |
|
|
2026 |
|
|
2025 |
|
||||
| Net Income (Loss) |
$ |
(1,172 |
) |
$ |
(1,492 |
) |
$ |
(2,777 |
) |
$ |
(3,007 |
) |
|||
| Income taxes |
|
– |
|
|
– |
|
|
– |
|
|
– |
|
|||
| Other Expense, net |
|
111 |
|
|
143 |
|
|
236 |
|
|
298 |
|
|||
| Depreciation and amortization |
|
490 |
|
|
561 |
|
|
997 |
|
|
1,098 |
|
|||
| EBITDA |
|
(571 |
) |
|
(788 |
) |
|
(1,544 |
) |
|
(1,611 |
) |
|||
| Severance costs |
|
16 |
|
|
163 |
|
|
38 |
|
|
210 |
|
|||
| Stock-based compensation |
|
402 |
|
|
383 |
|
|
882 |
|
|
828 |
|
|||
| Facility transition |
|
– |
|
|
– |
|
|
178 |
|
|
39 |
|
|||
| Deferred license revenue |
|
– |
|
|
– |
|
|
– |
|
|
(325 |
) |
|||
| Triferic inventory write-off |
|
– |
|
|
0 |
|
|
– |
|
|
178 |
|
|||
| Adjusted EBITDA |
$ |
(153 |
) |
$ |
(242 |
) |
$ |
(447 |
) |
$ |
(681 |
) |
|||
| Adjusted EPS |
$ |
(0.04 |
) |
$ |
(0.07 |
) |
$ |
(0.11 |
) |
$ |
(0.20 |
) |
|||
| Basic Weighted Average Shares Outstanding |
|
3,958,568 |
|
|
3,431,130 |
|
|
3,950,245 |
|
|
3,420,448 |
|
|||
View source version on businesswire.com: https://www.businesswire.com/news/home/20260813588314/en/
Media gallery
